Curate your Snowflake data warehouse, add semantic layers and query in plain English
Most companies have more data than they know what to do with. The problem isn’t access—it’s that the data lives in different systems, speaks different languages, and rarely connects in a meaningful way. In this post, I’ll walk through how to bring it all together in Snowflake and make it understandable not just for humans, but for AI.
1. Identify Your Data Sources
Before you touch Snowflake, before you think about dbt, before you even write your first Python script, there’s a more fundamental question to answer: where does your business actually live?
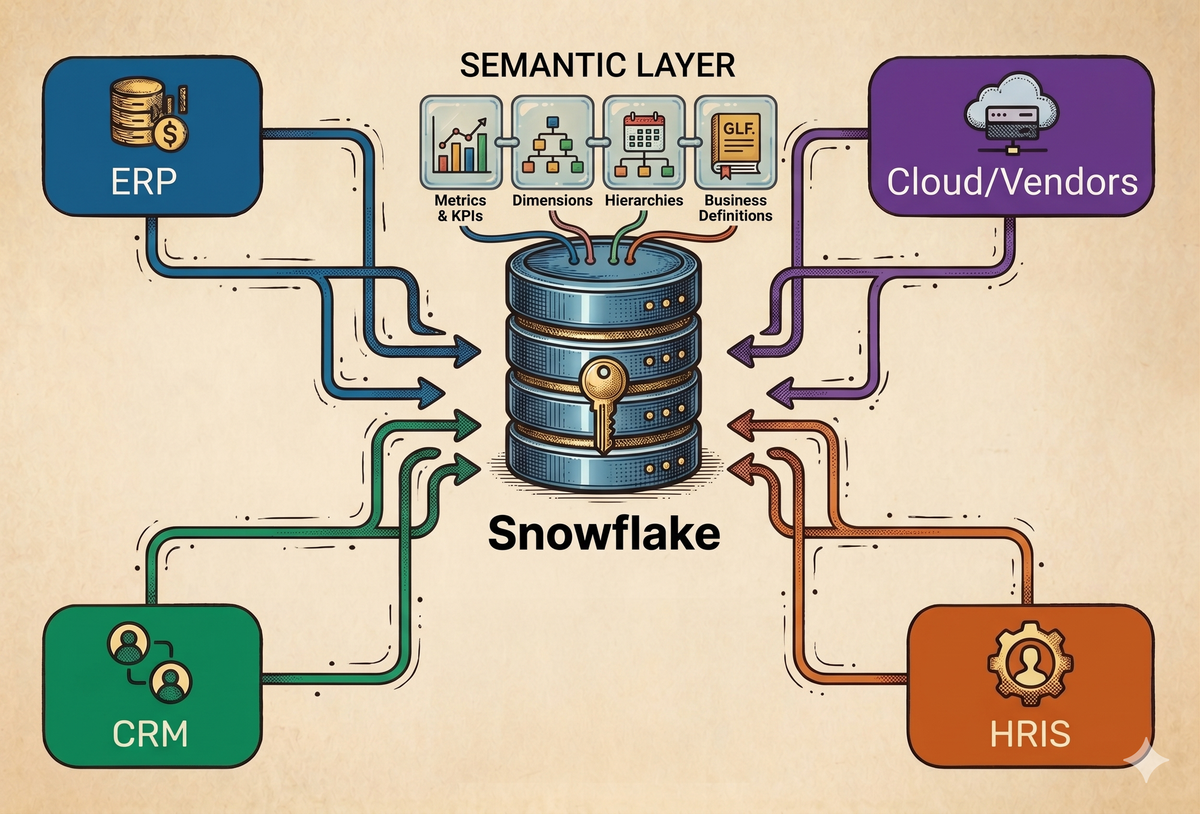
For most companies, the answer is fragmented. Financial truth sits in your ERP, revenue lives in your CRM, headcount is buried in your HRIS, and your cost structure is scattered across cloud providers and vendors. Each system is internally consistent, but none of them communicate in a meaningful way. You can answer questions within a single system, but the moment you try to connect them, you hit a wall.
Centralizing your data in Snowflake (or any data warehouse) isn’t just about consolidation. It’s about creating a space where dimensions from completely different systems can coexist. Once your ERP, CRM, HRIS, and vendor data are modeled together, you’re no longer analyzing systems—you’re analyzing the business itself.
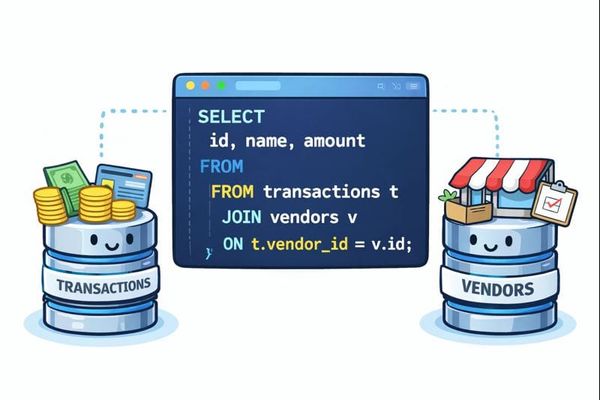
Most people will tell you that the value of a data warehouse is having a “single source of truth.” While that's partially true, the real value is that you can combine dimensions across systems in ways that were never possible before. You can look at headcount from your HRIS alongside payroll from your ERP. You can analyze ARR from Salesforce against compute costs from Azure or Google Cloud. You can break down spend from NetSuite by department definitions that only exist in your HR system.
In practice, this changes the types of questions you can ask. Instead of analyzing isolated metrics, you can start asking questions that reflect how the company truly operates. What is payroll per engineer relative to ARR? What percentage of revenue is driven by AI inference costs? Which departments are driving OpEx growth?
These aren’t edge cases—they’re the questions that matter. And they’re impossible to answer if your data remains siloed.
2. Data Curation
This is where most teams quietly sabotage everything they’re trying to build.
The instinct is to ingest everything—full tables, raw schemas, no filtering—and figure it out later. It feels efficient, but it creates a warehouse that is technically complete and practically unusable.
The problem isn’t volume—it’s ambiguity.
Raw data from systems like NetSuite or Salesforce is messy by design: inconsistent field names, IDs everywhere, and multiple ways to represent the same concept. A human can eventually work through that. An AI model won’t—it will guess.
A better approach is to curate data at ingestion. Instead of full tables, define reports or queries that reflect how your business actually thinks about the data. Rename fields into plain language, resolve IDs, and enforce a clean schema before anything lands in Snowflake.
This results in something like:
SALESFORCE_OPPORTUNITIES
- account_name
- arr (derived later)
- close_date
- stage
- contract_type
Instead of:
Opportunity__c (and 500+ loosely defined columns)This is no different than how you already build reports—you include the fields you actually use and ignore the rest.
Columns get renamed, IDs get mapped into human-readable values, and schemas are enforced so every field has a clear purpose. An account_id becomes account_name. A postingperiod becomes “Jan 2026.”
A simple rule: if a human analyst wouldn’t understand a column name, your AI won’t either.
What “good” looks like is straightforward. Instead of something like custrecord_mgmtreportinggrp_, you expose mgmt_reporting_group. Instead of Account.X2025_Account_Owner__c, you expose account_owner. By the time the data reaches Snowflake, it already speaks the language of the business.
The only thing to be careful about is preserving enough structure for tables to connect. Keep the keys that matter—primary keys and foreign keys—so your datasets can still join cleanly across systems. In some cases, you’ll even need to create those keys yourself to avoid relying on inconsistent fields like customer names. For example, you might store a netsuite_id in a custom field inside Salesforce Accounts, or use the Salesforce account_id as the external ID for NetSuite customers. This creates a reliable link between systems instead of depending on loosely matched text fields.
It does require some upfront mapping—and ongoing maintenance—but it’s well worth it. In practice, this is exactly the kind of task where tools like ChatGPT or Claude can help accelerate the mapping and cleanup process.
And this is where the payoff becomes clear: this level of curation doesn’t just make your warehouse cleaner—it makes your AI more accurate, because it’s working from focused, relevant fields instead of guessing across noisy, bloated tables.
3. Data Pipeline
At a high level, you have two paths.
You either go the Fivetran + dbt route, or you build it yourself.
Fivetran is the easy button for synchronization: you plug in your API credentials, and it handles everything else—scheduling, retries, incremental loads, and deduplication. It pulls full tables from systems like NetSuite or Salesforce into Snowflake. dbt then sits on top of that data and lets you transform it using SQL, narrowing those raw tables into the curated, business-friendly datasets we discussed earlier.
That path works well—until it doesn’t.
The moment you deal with custom reports, vendor billing APIs, or sources without connectors, you’re pushed into the second option: building your own pipelines. That sounds more complex than it actually is. In practice, it’s just a pattern—fetch the data from the source API, and handle the rest downstream.
For NetSuite, the easiest workflow starts by creating a SuiteAnalytics dataset and fetching it through the REST dataset endpoint:
def fetch_all_dataset_records(
    auth,
    dataset_id,
    limit=1000,
    page_sleep=1.0,
    max_retries=5,
    retry_wait=60,
):
    NS_COMPANY_ID = os.getenv("NS_PROD_COMPANY_ID")
    base_url = f"https://{NS_COMPANY_ID}.suitetalk.api.netsuite.com"
    endpoint = f"/services/rest/query/v1/dataset/{dataset_id}/result"
    offset, all_items = 0, []

    while True:
        url = f"{base_url}{endpoint}?limit={limit}&offset={offset}"
        response = requests.get(url, auth=auth, headers={"Prefer": "transient"})
        data = response.json()
        all_items.extend(data.get("items", []))
        if not data.get("hasMore"):
            break
        offset += limit
        time.sleep(page_sleep)

    return all_items
Salesforce follows a similar pattern, but instead of datasets, you start from reports. You fetch the report payload through the Analytics API as simply as this (note that this endpoint has a 2,000 rows limit so you might need to switch to SOQL queries in some instances):
def get_report(sf, report_id, include_details=True):
    params = {"includeDetails": str(include_details).lower()}
    return sf.restful(f"analytics/reports/{report_id}", params=params)
For cloud providers' usage and billing data, let's say for example Azure, there often isn’t a connector at all, so you have to build it yourself. You fetch usage and billing data directly from the API with something like this:
def fetch_costs_azure(token, subscription_id, start_date, end_date):
    url = (
        f"https://management.azure.com/subscriptions/{subscription_id}"
        f"/providers/Microsoft.Consumption/usageDetails"
        f"?api-version=2023-05-01&startDate={start_date}&endDate={end_date}"
    )
    headers = {"Authorization": f"Bearer {token}"}
    rows = []

    while url:
        resp = requests.get(url, headers=headers)
        js = resp.json()
        for item in js.get("value", []):
            props = item.get("properties", {})
            additional = props.pop("additionalProperties", {}) or {}
            rows.append({**props, **additional})
        url = js.get("nextLink")

    return rows
Once you see the pattern, it becomes repeatable across sources.
Here’s the tradeoff in plain terms:
| Approach | Pros | Cons |
|---|---|---|
| Fivetran + dbt | Fully automated, low maintenance, strong connector ecosystem, pre-built transformations | Adds cost, adds tools to learn, limited by available connectors |
| DIY (Python + GitHub Actions) | Works for almost any source, highly customizable, lower cost, full control | More maintenance, you own scheduling and failures, upsert logic requires care |
The codebase in the theaccountanthacodes repo includes the full implementation—how to transform and rename columns, map IDs into readable values, define Snowflake schemas (which is critical, since it enforces column types), and push the data into Snowflake.
4. Semantic Model
At this point, your data is clean, curated, and flowing into Snowflake. Most teams stop here.
But if you’re planning to use AI to analyze your data, the semantic layer is the big unlock—the rockstar that makes everything actually work.
A semantic model is simply a translation layer between your tables and your business. It defines what your data means, how key metrics are calculated, and how different people might refer to the same concept.
In practice, the semantic layer usually lives as a YAML file—a structured document that you can version control in your repository and inject into Snowflake. It describes your tables in plain English, defines metrics once with the correct logic, and maps synonyms so different ways of asking the same question resolve to the same answer.
Here’s a simplified example:
semantic_model:
  name: finance

  tables:
    - name: salesforce_opportunities
      description: Customer contract data from Salesforce. Source of truth for revenue.

      dimensions:
        - name: customer_name
          synonyms: [account, client, hospital]

      measures:
        - name: arr
          description: Annual Recurring Revenue (recurring, non-churned contracts only)
          expr: >
            SUM(annual_recurring_revenue)
            FILTER (WHERE contract_type = 'recurring' AND is_churned = FALSE)
          synonyms: [revenue, bookings, arr]
This does three things: it gives context to your tables, defines metrics with the correct business logic, and adds flexibility so natural language queries map to the right fields.
The impact on AI is immediate. Without a semantic model, you might ask “What is our ARR by customer?” and get different answers depending on how the model interprets your schema. With a semantic model, that same question consistently maps to the same table, the same fields, and the same definition of ARR.
Another important detail: you don’t have to start from scratch. Tools like ChatGPT Claude, or Snowflake's native Codex are surprisingly good at generating a first draft of the semantic model from your schema and a few examples. You still need to refine it, but they can accelerate what would otherwise be a tedious process.
My recommendation is to have the semantic model live alongside the pipelines in a GitHub repo, where it’s version-controlled and programmatically injected into Snowflake. The full example here shows how to define the model, maintain it over time, and deploy it as part of your data pipeline.
Once this layer is in place, you’re no longer just querying tables—you’re querying a shared understanding of the business.
5. AI-Powered Analytics
Once your warehouse is curated and your semantic layer is in place, something fundamentally changes.
You stop building dashboards as the primary way to access data.
Instead, your data becomes conversational.
Tools like Claude or ChatGPT can now sit directly on top of your warehouse and semantic model, allowing you to ask questions in plain English and get structured, reliable answers. The difference is not the AI itself—it’s the foundation you’ve built underneath it.
Snowflake, in particular, makes this very powerful. With its MCP integration, Claude can connect directly to your warehouse, access your tables, and leverage the semantic layer to generate accurate queries. At the same time, Snowflake gives you enterprise-grade control over access—you can define roles and permissions down to the table, column, or even row level (often through views). That means you can safely expose your warehouse to AI while still restricting sensitive data like payroll or compensation.
At this point, the workflow becomes much simpler. Instead of pre-building every possible dashboard, you can explore your data dynamically:
- “Which customers grew ARR by more than 20% this quarter?”
- “What’s our gross margin trend over the last 6 months?”
- “Which AWS services are driving the biggest cost increases?”
- “How does headcount compare to plan by department?”
These are multi-source questions that would normally require stitching together data across systems, writing custom SQL, and validating the logic. With the semantic layer in place, the AI handles that translation for you.
This doesn’t mean dashboards go away. They’re still useful for monitoring and standard reporting. But they’re no longer the only interface. They become one of many ways to interact with your data, not the bottleneck.
The real shift is that analysis becomes on-demand.
Instead of waiting for someone to build a report, anyone can ask a question and get an answer grounded in the same definitions and logic. Finance, operations, and leadership are all working off the same layer of truth, just through a more flexible interface.
And this is where the earlier steps pay off.
If your data is messy, AI amplifies the confusion.
If your data is curated but lacks a semantic layer, AI guesses.
But if both are in place, AI becomes a force multiplier.